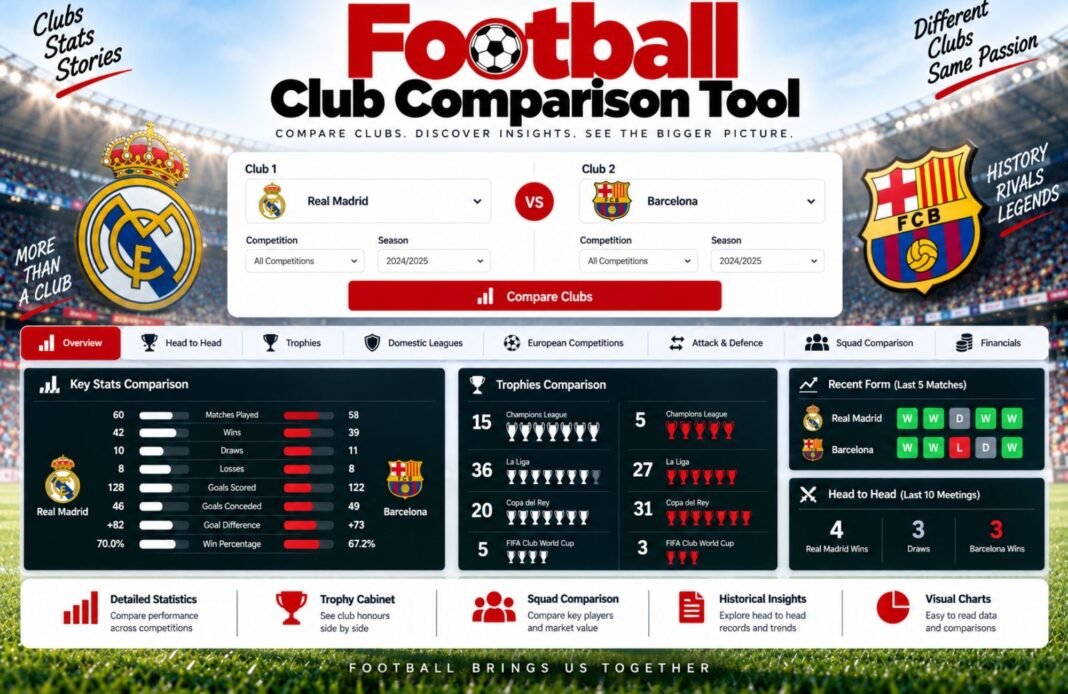
Want to compare two football clubs side by side? Our Football Club Comparison Tool helps you compare key stats such as trophies, wins, goals, league performance, and overall records. It’s a simple way to explore each club’s strengths and see how they match up.
Football Club Comparison Tool
Compare any two football clubs side by side. Enter their season records and see who wins on points per game, attack, defence, clean sheets and xG, plus each club’s 38-game points pace.
- Pick Clubs
- Enter Stats
- Comparison
Which Clubs Are You Comparing?
Any league, any level. Use stats from the same season or the same set of games for a fair comparison.
Enter Each Club’s Season Stats
Wins, draws, losses and goals are needed. The rest is optional and adds more categories.
Club
Club
Please enter wins, draws, losses, goals scored and goals conceded for both clubs. Clean sheets can’t be more than games played, and possession can’t be over 100%.
How Many Points Does A Top Club Need?
Premier League champions have averaged 87.7 points, while the team in 18th has averaged about 34.5.
How The Club Comparison Tool Works
Four quick steps from two season records to a clear verdict.
Name The Clubs
Type the two clubs you want to compare.
Enter The Stats
Add wins, draws, losses and goals, plus any extras.
See The Verdict
Find out which club wins each category and overall.
Check The Pace
Compare each club’s 38-game points pace with real benchmarks.
What Is The Football Club Comparison Tool?
The GlobeHour Football Club Comparison Tool puts two clubs side by side using their actual results. Enter each club’s wins, draws, losses, goals scored and goals conceded, and the tool turns them into fair per-game numbers so you can see which club is really performing better.
It works for any league and any level, from the Premier League to your local Sunday league. Add clean sheets, expected goals (xG), xG against and average possession for an even deeper comparison. The tool counts how many categories each club wins, shows the better figure in every row and projects each club’s points over a 38-game season.
How Each Category Is Calculated
Example: City Rovers (W20 D8 L4, 65 scored, 30 conceded) against United Town (W18 D7 L7, 70 scored, 41 conceded), both after 32 games.
| Category | Formula | Example |
|---|---|---|
| Points Per Game | (Wins × 3 + draws) ÷ games | 68 ÷ 32 = 2.13 vs 61 ÷ 32 = 1.91 |
| Win Rate | Wins ÷ games × 100 | 62.5% vs 56.3% |
| Unbeaten Rate | (Wins + draws) ÷ games × 100 | 87.5% vs 78.1% |
| Goals Scored Per Game | Goals scored ÷ games | 2.03 vs 2.19 |
| Goals Conceded Per Game | Goals conceded ÷ games (lower is better) | 0.94 vs 1.28 |
| Goal Difference Per Game | (Scored − conceded) ÷ games | +1.09 vs +0.91 |
| 38-Game Points Pace | Points per game × 38 | 81 vs 72 |
With clean sheets, xG, xG against and possession added, City Rovers wins 8 categories and United Town wins 2. Possession is shown for style only and has no winner.
Why Per-Game Numbers Matter
Clubs often have games in hand, so comparing total points or total goals can be misleading. A club with 60 points from 30 games is doing better than a club with 62 points from 34 games. That’s why every category in this tool is worked out per game or as a percentage.
The 38-game points pace takes this one step further by showing what each club’s current form would be worth over a full Premier League season. You can then compare it with the benchmarks in the figure above.
Why Compare xG As Well As Goals?
Goals decide matches, but they can be affected by luck over a short run. Expected goals (xG) measures the quality of the chances a team creates, and xG against measures the quality of the chances it allows.
If one club is ahead on goals but behind on xG difference, it may be riding its luck with excellent finishing or goalkeeping. In the example, United Town scores more goals and creates more xG, but City Rovers allows far fewer chances, which is why it wins on xG difference per game.
- xG per game: how good a club’s attack is at creating chances.
- xG against per game: how well a club stops opponents creating chances. Lower is better.
- xG difference per game: xG minus xG against, the best single number for overall chance quality.
Ways To Use The Club Comparison Tool
- Settle debates about which rival is having the better season.
- Compare two title or relegation rivals with games in hand.
- Check whether a club’s position matches its xG numbers.
- Compare your local team’s season with last season’s.
- Preview a big match by comparing both clubs’ form.
- Use the Swap Clubs button to flip the order instantly.
- Compare home and away records by entering them as two clubs.
- Copy the result to share it with friends or on social media.
Football Club Comparison Tool FAQ
How Do I Compare Two Football Clubs?
Enter both club names, then add each club’s wins, draws, losses, goals scored and goals conceded. Press Compare Clubs to see the winner in each category.
Is The Club Comparison Tool Free?
Yes. It is completely free, needs no sign-up and works on phones, tablets and computers.
Where Can I Find Club Stats?
League tables on official league websites show wins, draws, losses and goals. Many football data sites also list clean sheets, xG and possession.
How Is The Overall Winner Decided?
The tool counts how many categories each club wins. Possession is shown for style only and doesn’t count towards the score.
How Many Points Does It Take To Win The Premier League?
Premier League champions have averaged 87.7 points. The lowest title-winning total is 75 points and the record is 100.
How Many Points Are Needed To Avoid Relegation?
The team in 18th place has averaged about 34.5 points across 38-game Premier League seasons, according to The Analyst.
Can I Compare Clubs That Have Played A Different Number Of Games?
Yes. Every category is worked out per game or as a percentage, so games in hand don’t affect the comparison.
Does It Work For Leagues Other Than The Premier League?
Yes. It works for any league or level. The 38-game benchmarks are based on the Premier League.
Is My Information Saved?
The stats you enter are saved only in your own browser. Nothing is sent to GlobeHour.
Related GlobeHour Football Tools
Ready To Compare Two Clubs?
Wins, draws, losses and goals are all you need. Get a clear head-to-head verdict in seconds.
Open The Club Comparison Tool