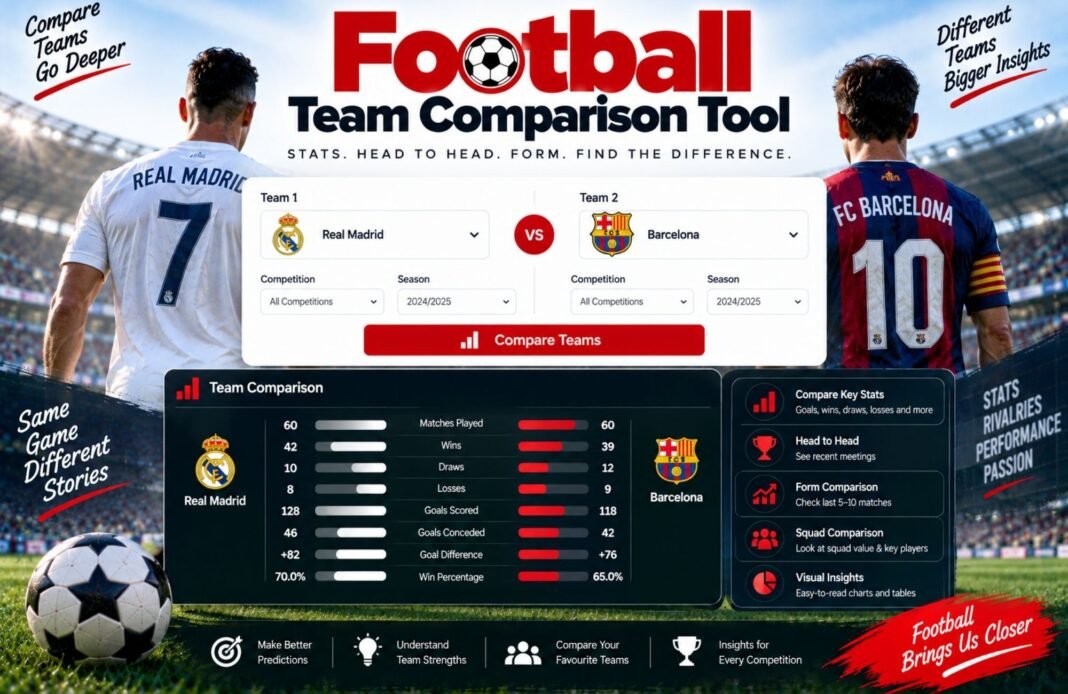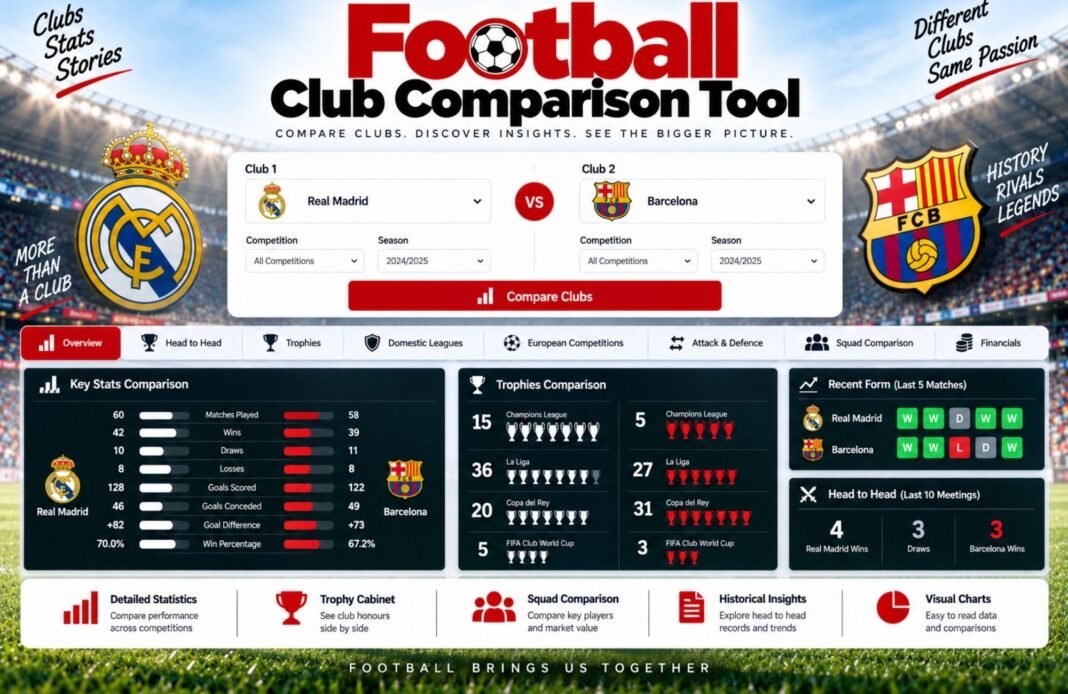
Want to compare two football clubs side by side? Our Football Club Comparison Tool helps you compare key stats such as trophies, wins, goals, league performance, and overall records. It’s a simple way to explore each club’s strengths and see how they match up.
Football Club Comparison Tool
Compare two football clubs side by side using wins, draws, losses, points per game, win percentage, goals scored, goals conceded, goal difference and clean-sheet rate.
Football Club Comparison Tool
Enter both clubs from the same or comparable competition period. The tool calculates standard 3-1-0 league points and compares performance rates so different sample sizes are easier to judge.
Compare Club A And Club B
Use the same statistical period whenever possible. Wins + draws + losses automatically determine each club’s games played.
Club A Statistics
Club B Statistics
How The Football Club Comparison Tool Works
The tool converts each club’s raw record into comparable rates, then awards one comparison point to the better club in each of six categories. Exact ties split the category.
Rate-based metrics are especially useful when Club A and Club B have not played the same number of matches.
Football Club Comparison Tool: What You Can Compare
The Football Club Comparison Tool turns two win-draw-loss records into a side-by-side performance summary. Instead of looking only at total wins or total points, it calculates rates that make different sample sizes easier to compare.
You can compare league points, points per game, win percentage, goal scoring, goals conceded, goal difference and clean-sheet percentage. The final comparison score is not a prediction of who would win a head-to-head match. It only summarizes the statistical sample you entered.
Why Points Per Game Is Important When Comparing Football Clubs
Total points can be misleading when clubs have played different numbers of matches. A club with 60 points from 35 matches has collected more raw points than a club with 57 points from 30 matches, but the second club has the stronger points-per-game rate.
That is why this comparison tool uses PPG as one of its primary categories. PPG divides points by games played, giving a cleaner view of how quickly each club is collecting league points.
Raw Points Still Matter
In an actual league table, the official total remains important. The tool therefore displays raw standard points alongside PPG rather than replacing one with the other.
Football Club Comparison Metrics Explained
Each metric answers a different question. A stronger attack does not automatically mean a stronger overall record, and a strong clean-sheet rate does not necessarily mean the club scores enough goals.
| Metric | Formula | What It Shows | Better Direction |
|---|---|---|---|
| Points Per Game | Points ÷ Games | Rate of league-point collection. | Higher |
| Win Percentage | (Wins ÷ Games) × 100 | Share of matches won. | Higher |
| Goals For / Game | Goals For ÷ Games | Average scoring rate. | Higher |
| Goals Against / Game | Goals Against ÷ Games | Average conceding rate. | Lower |
| Goal Difference / Game | (GF − GA) ÷ Games | Net scoring margin per match. | Higher |
| Clean Sheet % | (Clean Sheets ÷ Games) × 100 | Share of matches without conceding. | Higher |
How To Use The Football Club Comparison Tool
Start by entering a name for each club. The names are optional, but they make the result and PDF easier to read. Then enter wins, draws, losses, goals for, goals against and clean sheets for the same time period.
Use Comparable Samples
The best comparison uses the same competition and season stage. Comparing one club’s domestic league record with another club’s mixed league-and-cup record can create a distorted result because the opposition and format are different.
Check The Record Before Calculating
Wins, draws and losses are added automatically to calculate games played. Clean sheets cannot be higher than games played. Goals for and goals against should come from the same match sample as the W-D-L record.
Read The Categories, Not Only The Winner
The overall comparison winner simply tells you which club leads more of the six selected rate-based categories. The detailed table matters more because it shows where each club is stronger.
Example Football Club Comparison
This worked example shows how two clubs with the same 30-match sample can differ across attack, defense and results.
| Metric | Example Club A | Example Club B | Leader |
|---|---|---|---|
| Record | 18W-7D-5L | 16W-8D-6L | Club A |
| Points | 61 | 56 | Club A |
| Win % | 60.0% | 53.3% | Club A |
| Goals / Game | 2.07 | 1.83 | Club A |
| Goals Against / Game | 1.03 | 1.20 | Club A |
| Clean Sheet % | 40.0% | 33.3% | Club A |
Attack vs Defense In A Football Club Comparison
Goals scored per game provides a simple view of attacking output, while goals conceded per game gives the opposite defensive view. Neither metric explains everything about chance quality, possession style or opponent strength, but together they make the comparison more balanced.
Goal Difference Per Game
Goal difference per game combines attack and defense into one net rate. A positive number means the club scores more than it concedes on average. A negative number means the opposite.
Clean Sheets Add A Different Defensive View
A low goals-against rate and a high clean-sheet percentage often point in the same direction, but not always. A club may keep many clean sheets while occasionally suffering heavy defeats, so both metrics are worth displaying separately.
When A Football Club Comparison Can Be Misleading
Numbers are useful only when the samples are reasonably comparable. A club playing stronger opposition may have worse raw rates while still performing at a higher underlying level.
Different Competitions
League strength and playing style can vary, so identical rates do not automatically represent identical quality.
Different Sample Sizes
Rate statistics help, but a five-match sample is still less stable than a full-season record.
Schedule Difficulty
One club may have faced a much stronger run of opponents than the other.
Injuries And Rotation
Availability changes can affect a short-term record without representing the club’s normal level.
Red Cards And Game State
Unusual match situations can heavily influence goals and results.
Style Of Play
Possession, counter-attacking and defensive systems can produce different statistical profiles.
Football Club Comparison vs Head-To-Head Record
This tool compares each club’s broader statistical record. It does not calculate historical head-to-head results between the two clubs. Those are different questions.
A club can have the stronger season record but a poor head-to-head history against a particular opponent. Conversely, one club may win a recent direct meeting while still having weaker performance rates over the full season.
Use the right sample: choose season statistics for overall club strength, or direct head-to-head match data when your question is specifically about previous meetings.
Standard League Points In The Comparison
The tool uses the common 3-1-0 league points system: three points for a win, one for a draw and zero for a defeat. This makes raw points and points per game easy to compare alongside the other club metrics.
If you are comparing clubs from a competition with a different table system, focus more on win rate, scoring rate, conceding rate and clean-sheet rate rather than the standard points output shown here.
Related GlobeHour Football Tools
Use these GlobeHour tools for more football performance context.
Football Club Comparison Tool Methodology & Sources
The calculations on this page are transparent arithmetic based on the match record you enter. The comparison winner is a GlobeHour summary of six rate-based categories and should not be treated as an official ranking or match prediction.
IFAB Law 10 states that the team scoring the greater number of goals wins a match and equal scores produce a draw. Standard league points are then assigned according to the competition’s rules; the Premier League uses three points for a win, one for a draw and none for a defeat.
Football Club Comparison Tool FAQ
Quick answers about comparing club records and performance rates.
How does the Football Club Comparison Tool work?
Enter wins, draws, losses, goals for, goals against and clean sheets for Club A and Club B. The tool calculates points and performance rates, then compares six rate-based categories.
What determines the overall comparison winner?
The tool compares points per game, win percentage, goals scored per game, goals conceded per game, goal difference per game and clean-sheet percentage. The club leading more categories wins the summary comparison.
Can I compare clubs that played different numbers of games?
Yes. Rate-based metrics make that more useful than comparing raw totals alone, although larger and more comparable samples are still preferable.
Does this tool predict which club will win a match?
No. It summarizes the statistics you enter and does not model injuries, lineups, opponent strength, home advantage or future match conditions.
How are football points calculated?
The tool uses three points for a win, one for a draw and zero for a loss.
Why is goals against per game better when lower?
A lower goals-against rate means the club concedes fewer goals per match over the entered sample.
What if both clubs tie a comparison metric?
An exact tie splits that category equally between Club A and Club B.
Can I download the comparison?
Yes. The result includes a direct PDF download with “Generated by GlobeHour.com”.
Compare Two Football Clubs
Enter Club A and Club B statistics to compare results, attack, defense and clean-sheet performance in one calculation.
Open Football Club Comparison Tool