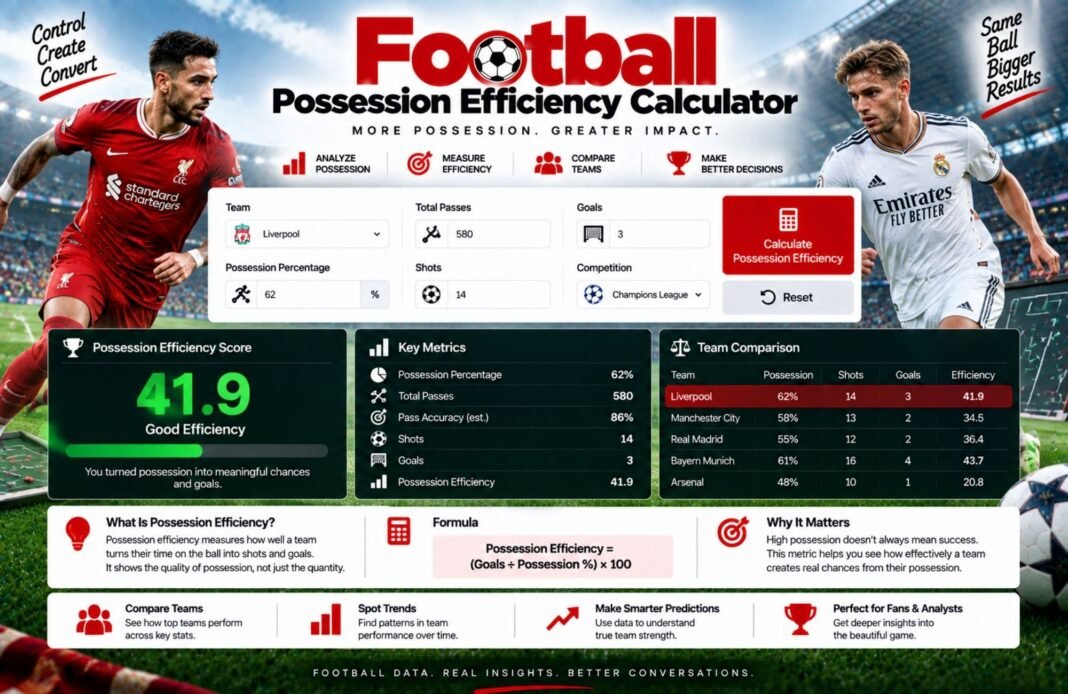
Want to know how effectively a team uses the ball? Our Possession Efficiency Calculator helps measure how well possession is turned into meaningful attacking actions such as shots, chances, and goals. It’s a simple way to compare teams and understand whether keeping more of the ball is actually producing results.
Possession Efficiency Calculator
Find out whether a team’s possession actually turns into chances. Compare share of the ball with share of shots and expected goals, and see shots and xG for every 10% of possession.
- Match Setup
- Enter Stats
- Efficiency
What Are You Analysing?
Use the stats from one match, or a team’s season averages per match.
Enter The Match Stats
Enter the stats from one match.
Your Team
Opponent
Passing (optional, your team)
Enter shots and goals for both teams. Shots on target can’t be more than shots.
Efficiency ratios are GlobeHour’s own simple measures. xG values differ between data providers, so use the same source for both teams.
Possession Versus Chances
An example match where one team had most of the ball but the other created the better chances.
How The Possession Efficiency Calculator Works
Four quick steps from a match report to a clear verdict.
Set Up The Match
Choose a single match or season averages and name both teams.
Enter The Stats
Add possession, shots, shots on target, goals and xG for both sides.
Compare Shares
See each team’s share of the ball, shots, xG and goals side by side.
Read The Style
Get a playing style label and plain-English takeaways.
What Is Possession Efficiency?
Possession tells you how much of the ball a team had, but not what they did with it. A side can keep the ball for long spells without ever threatening the goal, while another can score from very little of the ball with quick, direct attacks.
Possession efficiency compares a team’s share of the ball with its share of the chances. The GlobeHour Possession Efficiency Calculator works out two simple ratios: the share of shots a team took divided by its share of possession, and, if you add expected goals, the share of xG divided by the share of possession. A ratio above 1 means the team created more than its share of the ball suggests.
Possession Efficiency Formulas
Example: Home FC 62% possession, 12 shots, 4 on target, 1 goal, 1.10 xG. Away United 8 shots, 3 on target, 1 goal, 1.30 xG.
| Measure | Formula | Home FC Example |
|---|---|---|
| Shot Share | Team shots ÷ total shots | 12 ÷ 20 = 60.0% |
| Shot Efficiency Ratio | Shot share ÷ possession share | 60.0% ÷ 62% = 0.97× |
| xG Share | Team xG ÷ total xG | 1.10 ÷ 2.40 = 45.8% |
| xG Efficiency Ratio | xG share ÷ possession share | 45.8% ÷ 62% = 0.74× |
| Shots Per 10% Possession | Shots ÷ (possession ÷ 10) | 12 ÷ 6.2 = 1.94 |
| xG Per 10% Possession | xG ÷ (possession ÷ 10) | 1.10 ÷ 6.2 = 0.177 |
| xG Per Shot | xG ÷ shots | 1.10 ÷ 12 = 0.092 |
| Shot Accuracy | Shots on target ÷ shots | 4 ÷ 12 = 33.3% |
In this example Away United had only 38% of the ball but 54.2% of the xG, an xG efficiency ratio of 1.43×, and created far better chances at 0.163 xG per shot.
The Five Possession Styles
How the calculator labels a team, using the xG ratio when xG is entered and the shot ratio when it is not.
Dominant Control
55%+ Possession · Ratio 1.0 Or MoreThe team had most of the ball and created at least its share of the chances. Possession was a weapon, not just a habit.
Sterile Possession
55%+ Possession · Ratio Below 0.9Lots of the ball but not enough threat. Passes went sideways and backwards more than through the lines.
Ruthless Counter
45% Or Less · Ratio 1.1 Or MoreLess of the ball, more than its share of the danger. A clear sign of fast, direct and well-drilled attacks.
Under Pressure
45% Or Less · Ratio Below 1.0The team had little of the ball and could not make it count. Usually a match spent defending.
Balanced
Everything In BetweenPossession and chances were roughly in line, or the match was too even to call a clear style.
Why Possession Is Not Everything
- Game state matters. A team that is winning often lets the opponent have the ball, so their possession drops while their efficiency can rise.
- Where the ball is matters. Possession in your own half is far less dangerous than possession near the opponent’s box.
- Shot quality matters. Ten long-range shots can be worth less than two chances from inside the six-yard box, which is why xG is so useful.
- One match is a small sample. Finishing and goalkeeping can swing a single game, so look at several matches or season averages.
How To Make Possession Count
- Move the ball forward quickly when the opponent is out of shape.
- Get runners in behind the defense to stretch the game.
- Work the ball into the box rather than shooting from distance.
- Use wide players to pull defenders apart.
- Counter-press after losing the ball to win it back high.
- Track xG per shot to judge chance quality.
- Compare several matches before drawing conclusions.
- Use the same data source for both teams.
Possession Efficiency Calculator FAQ
What Is Possession Efficiency In Football?
It compares a team’s share of the ball with its share of the chances. If a team has 60% possession but only 40% of the shots or xG, it used the ball inefficiently.
Is The Possession Efficiency Calculator Free?
Yes. It is completely free, needs no sign-up and works on phones, tablets and computers.
How Is The Efficiency Ratio Calculated?
Divide the team’s share of shots, or share of xG, by its share of possession. A ratio of 1.0 means chances matched possession exactly.
What Is A Good Efficiency Ratio?
Above 1.1 is labelled efficient, 0.9 to 1.1 is in line with possession, and below 0.9 is inefficient.
Do I Need xG?
No. Without xG the calculator uses shots. Adding xG for both teams gives a better picture because it measures chance quality.
Where Can I Find xG For A Match?
Many football statistics websites and apps publish xG after matches. Use the same source for both teams, because different providers use different models.
Can I Use Season Averages?
Yes. Choose Season Average and enter averages per match, such as 13.4 shots and 1.6 xG.
Does More Possession Mean A Team Played Better?
Not always. Teams that are winning often give up possession, and counter-attacking teams can create more from less of the ball.
What Is xG Per Shot?
It is total xG divided by shots. A higher number means the team created better-quality chances on average.
Is My Information Saved?
Your inputs are saved only in your own browser. Nothing is sent to GlobeHour.
Related GlobeHour Football Tools
Ready To Analyse A Match?
Possession, shots and goals are all you need. Add xG for the full picture.
Open The Possession Calculator