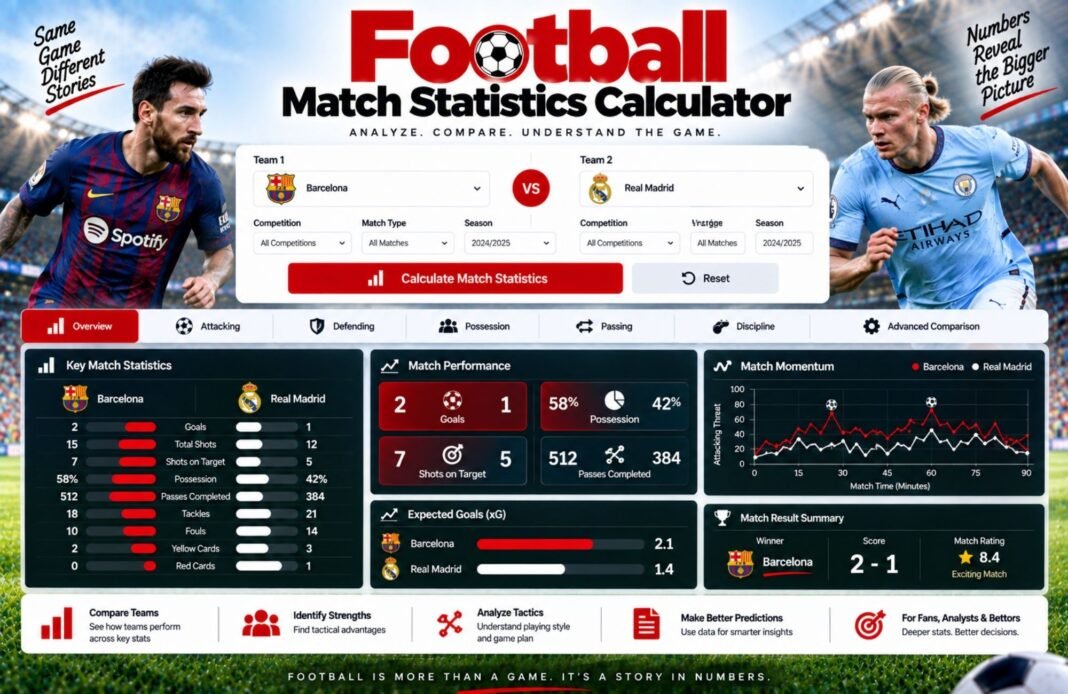
Want to turn match numbers into useful insights? Our Football Match Statistics Calculator helps you calculate and review key stats such as goals, shots, possession, passing, and defensive actions. It’s a simple way to understand match performance and compare how teams performed.
Football Match Statistics Calculator
Turn raw match numbers into a full stat sheet. Calculate possession from passes, shot accuracy, conversion, pass and cross accuracy, tackle success, aerial duels won and save percentage for both teams, side by side.
- Teams
- Raw Numbers
- Stat Sheet
Which Match Are You Analysing?
Enter both teams. It works for any level, from the Premier League to a Sunday league game you tracked yourself.
Enter The Raw Match Numbers
Only goals and shots are required. Every extra number unlocks more stats.
Team
Shooting
Passing
Defending
Set Pieces And Discipline
Team
Shooting
Passing
Defending
Set Pieces And Discipline
Please check the numbers: goals and shots are needed for both teams, completed can’t be more than attempted, shots on target can’t be more than shots, and saves plus goals can’t be more than the other team’s shots on target.
Why Do Possession Numbers Differ?
Data companies don’t all measure possession the same way.
How The Match Statistics Calculator Works
Four quick steps from raw numbers to a full stat sheet.
Name The Teams
Enter the home and away team.
Enter Raw Numbers
Add goals, shots, passes, tackles and more.
Get The Stat Sheet
See every percentage worked out side by side.
Copy And Share
Copy the full stat sheet in one click.
What Is The Football Match Statistics Calculator?
Broadcasters and data sites show percentages like possession, pass accuracy and shot accuracy, but if you track a match yourself, you only have raw counts. The GlobeHour Football Match Statistics Calculator turns those counts into the same kind of stat sheet you see on TV.
Enter what you have for each team, from goals and shots to passes, crosses, tackles, aerial duels, saves, corners, fouls and cards. The calculator works out every percentage, shows which team leads each stat and adds up the match totals. It’s ideal for coaches, analysts, writers and parents tracking grassroots games.
Match Statistics Formulas
Example: City Rovers 2–1 United Town, using the example match in the calculator.
| Stat | Formula | City Rovers | United Town |
|---|---|---|---|
| Possession (Pass-Based) | Completed passes ÷ both teams’ completed passes | 470 ÷ 795 = 59.1% | 40.9% |
| Shot Accuracy | Shots on target ÷ shots | 6 ÷ 16 = 37.5% | 3 ÷ 7 = 42.9% |
| Shot Conversion | Goals ÷ shots | 2 ÷ 16 = 12.5% | 1 ÷ 7 = 14.3% |
| Pass Accuracy | Completed ÷ attempted passes | 470 ÷ 540 = 87.0% | 325 ÷ 410 = 79.3% |
| Cross Accuracy | Completed ÷ attempted crosses | 6 ÷ 22 = 27.3% | 2 ÷ 10 = 20.0% |
| Tackle Success | Tackles won ÷ attempted | 12 ÷ 18 = 66.7% | 14 ÷ 21 = 66.7% |
| Aerial Duels Won | Team’s aerials won ÷ all aerials won | 14 ÷ 25 = 56.0% | 44.0% |
| Save Percentage | Saves ÷ opponent’s shots on target | 2 ÷ 3 = 66.7% | 4 ÷ 6 = 66.7% |
In this example, City Rovers lead 10 stats and United Town lead 2, but United Town were more accurate and more clinical with the few shots they had.
Pass-Based Vs Time-Based Possession
There are two main ways to measure possession:
- Pass-based: used by Opta. A team’s possession is its share of all completed passes in the match. It’s easy to calculate from match data, which is why this calculator uses it.
- Time-based: a person or tracking system records how long each team has the ball, like a chess clock, and ignores time when the ball is out of play.
Because the pass-based method counts passes rather than seconds, teams that play lots of short passes can show more possession than a stopwatch would give them. If you have a time-based figure, enter it to compare the two side by side. If completed passes aren’t available, the calculator uses passes attempted instead.
How To Track Match Stats Yourself
You don’t need expensive software to collect useful numbers. A simple tally sheet works well:
- Shots: mark every attempt at goal, and circle the ones that are on target.
- Passes: count attempts and completions for one half at a time, or ask a helper for each team.
- Defending: note tackles won and lost, aerial duels won and goalkeeper saves.
- Set pieces and discipline: count corners, offsides, fouls and cards.
Tips For Reading Match Statistics
- More possession doesn’t always mean a team played better.
- Shot accuracy and conversion show quality, not just quantity.
- Low pass accuracy can mean a more direct, risky style.
- A high save percentage often means a goalkeeper kept a team in the game.
- Lots of fouls per card suggests a lenient referee or small fouls.
- Check whether a red card changed the numbers in the second half.
- Use the same counting rules for every match you track.
- Copy the stat sheet to share it in a team group or report.
Football Match Statistics Calculator FAQ
How Do You Calculate Possession In Football?
With the pass-based method used by Opta, divide a team’s completed passes by the total completed passes of both teams. For example, 470 out of 795 is 59.1%.
Is The Match Statistics Calculator Free?
Yes. It is completely free, needs no sign-up and works on phones, tablets and computers.
Which Stats Are Required?
Only goals and shots for both teams. Everything else is optional and unlocks extra stats.
How Is Shot Accuracy Calculated?
Divide shots on target by total shots. For example, 6 on target from 16 shots is 37.5%.
How Is Pass Accuracy Calculated?
Divide completed passes by attempted passes. For example, 470 completed from 540 attempted is 87.0%.
How Is Save Percentage Calculated?
Divide a team’s saves by the other team’s shots on target. For example, 4 saves from 6 shots on target is 66.7%.
Why Is Possession Different On Different Websites?
Some providers use passes and others use time. At the 2014 World Cup, Spain’s possession against the Netherlands was 64% by passes but 57% by time.
Can I Use It For Grassroots Football?
Yes. Count the numbers yourself during or after the game and enter them. Any level of football works.
Is My Information Saved?
The numbers you enter are saved only in your own browser. Nothing is sent to GlobeHour.
Related GlobeHour Football Tools
Ready To Build A Stat Sheet?
Goals and shots are all you need to start. Add more numbers for a full, TV-style match report.
Open The Match Statistics Calculator