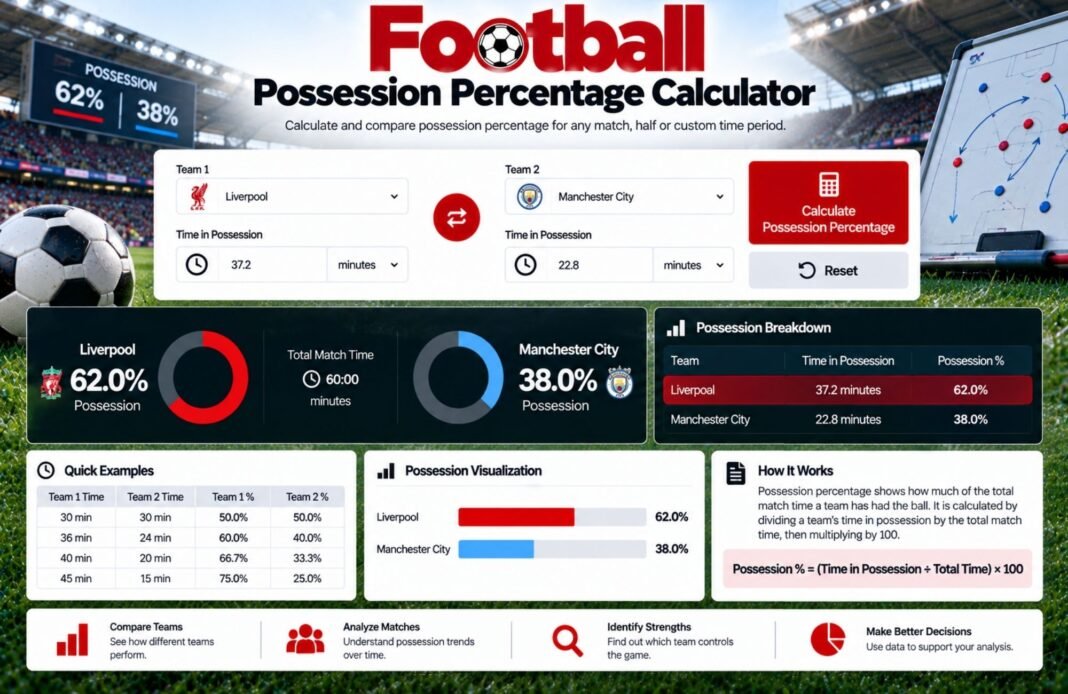
Want to know how much of the ball a team controlled during a match? Our Possession Percentage Calculator quickly works out each team’s share of possession. It’s a simple way to compare control of the game and understand how the match was played.
Possession Percentage Calculator
Work out football possession three ways: from passes like Opta, from time on the ball like a stopwatch, or as a season average from your match-by-match figures.
- Method
- Enter Numbers
- Possession
How Do You Want To Calculate Possession?
Pick the method that matches the numbers you have.
Enter The Numbers
Enter each team’s passes. Completed passes are the standard Opta method.
Enter each team’s time on the ball as minutes:seconds, for example 31:20.
Enter the possession % from each match, separated by commas or spaces.
Use your team’s figure for every match, from 0 to 100.
Please check the numbers. Enter values for both teams, times as minutes:seconds (seconds up to 59), and match figures between 0 and 100.
How Long Is The Ball Actually In Play?
A Premier League match lasts over 90 minutes, but the ball is only in play for about 55 to 58 of them.
How The Possession Percentage Calculator Works
Four quick steps to an exact possession figure.
Choose A Method
Passes, time on the ball or a season average.
Enter The Numbers
Add passes, times or match-by-match figures.
Get The Split
See each team’s possession percentage.
Copy And Share
Copy the result in one click.
What Is Possession Percentage?
Possession percentage shows how much of the ball each team had in a match. If one team has 60%, the other has 40%, as the two figures always add up to 100%. It’s one of the first stats people look at after a game, because it shows which team controlled the ball.
The GlobeHour Possession Percentage Calculator lets you work it out yourself, whether you have pass counts from a data site, times from a stopwatch at a grassroots match or a list of figures from a whole season. It also shows ball-in-play time and how a season’s possession is spread across matches.
Possession Percentage Formulas
Examples from the calculator’s example data.
| Method | Formula | Example |
|---|---|---|
| From Passes | Team’s completed passes ÷ both teams’ completed passes × 100 | 470 ÷ (470 + 325) = 59.1% |
| From Time | Team’s time on ball ÷ total ball-in-play time × 100 | 32:30 ÷ 57:00 = 57.0% |
| Ball In Play | Both teams’ time on the ball added together | 32:30 + 24:30 = 57:00 |
| In-Play Share | Ball in play ÷ (ball in play + ball out of play) × 100 | 57:00 ÷ 96:00 = 59.4% |
| Season Average | Sum of match figures ÷ number of matches | 441 ÷ 8 = 55.1% |
The season example uses 58, 62, 47, 55, 64, 51, 44 and 60. That gives an average of 55.1%, a median of 56.5%, a high of 64% and a low of 44%, with more of the ball in 6 matches and less in 2.
Pass-Based Vs Time-Based Possession
Data companies don’t all measure possession the same way, which is why websites sometimes show different figures for the same match.
- Pass-based: used by Opta. It counts each team’s share of completed passes. It’s quick to calculate and needs no stopwatch, but it can favour teams that play lots of short passes.
- Time-based: measures how long each team actually has the ball, like a chess clock, and ignores stoppages when the ball is out of play.
For grassroots matches, the pass-based method is usually easier: count passes for each team, or just count completed passes if that’s all you can track.
What Does Your Possession Say About Your Style?
| Possession | Label | Typical Style |
|---|---|---|
| 65% Or More | Total Control | Patient build-up, keeps the ball for long spells |
| 55% To 64% | More Of The Ball | Controls games but mixes in direct play |
| 46% To 54% | Even Split | Balanced, neither side dominates the ball |
| 36% To 45% | Less Of The Ball | Happy to defend and counter-attack |
| 35% Or Less | Playing Without The Ball | Deep defending and quick breaks |
Possession Percentage Calculator FAQ
How Do You Calculate Possession In Football?
The most common method divides a team’s completed passes by the total completed passes of both teams. For example, 470 out of 795 is 59.1% possession.
Is The Possession Calculator Free?
Yes. It is completely free, needs no sign-up and works on phones, tablets and computers.
Can I Calculate Possession From Time?
Yes. Choose From Time and enter each team’s time on the ball as minutes:seconds. Possession is each team’s share of the total ball-in-play time.
How Long Is The Ball In Play In A Premier League Match?
The average was 56 minutes 59 seconds in 2024/25, according to Opta data reported by The Analyst. The record is 58:11 from 2023/24.
Why Do Websites Show Different Possession Figures?
Some providers use passes and others use time, so the same match can have slightly different possession numbers.
How Do I Work Out Average Possession For A Season?
Choose Season Average and enter your possession figure from every match. The calculator gives the average, median, highest, lowest and how many matches were over 50%.
Does More Possession Mean A Team Played Better?
Not always. Many teams win while having less of the ball. What a team does with possession matters more than how much it has.
Can I Use Passes Attempted Instead Of Completed?
Yes. Switch to Passes Attempted if that’s the only number you have. Use the same stat for both teams.
Is My Information Saved?
The numbers you enter are saved only in your own browser. Nothing is sent to GlobeHour.
Related GlobeHour Football Tools
Ready To Calculate Possession?
Passes, time or a season of results: pick your method and get the possession split in seconds.
Open The Possession Calculator