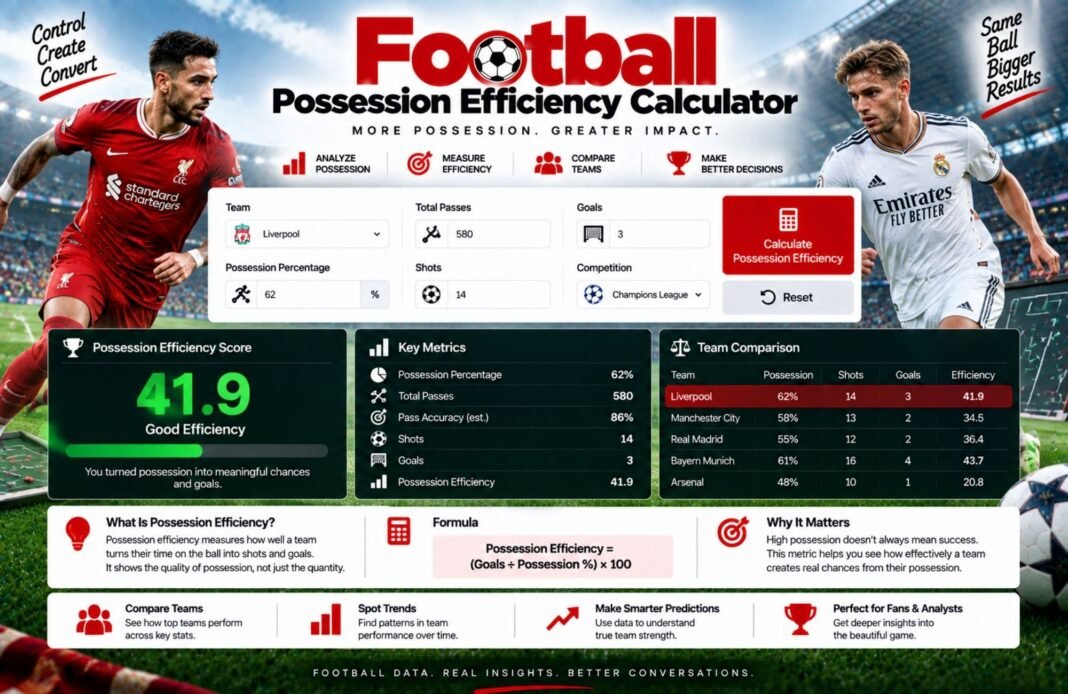
Want to know how clinical a player is in front of goal? Our Shot Conversion Rate Calculator shows what percentage of a player’s shots turn into goals. Just enter total goals and shots to quickly measure finishing efficiency and compare scoring performance.
Shot Conversion Rate Calculator
Find out how many shots turn into goals. Get the conversion rate, shots per goal, shot accuracy, non-penalty conversion and goals versus xG, then compare inside and outside the box with Premier League benchmarks.
- Record Type
- Enter Shots
- Conversion Rate
Whose Shots Are You Measuring?
Use it for one player’s finishing or a whole team’s attack.
Enter Shots And Goals
Shots and goals are all you need. Everything else is optional and adds more detail.
Accuracy, xG And Minutes (optional)
Penalties And Shot Location (optional)
Target (optional)
Please check the numbers: goals can’t be more than shots, and the optional parts can’t be more than their totals.
Compare Finishers
Rank players or teams by conversion rate. Saved in this browser.
How Often Does Each Type Of Shot Go In?
Where a shot is taken from matters more than almost anything else.
How The Shot Conversion Calculator Works
Four quick steps from a shot record to a clear finishing picture.
Choose The Record
Pick a single player or a whole team.
Enter The Shots
Add shots and goals, plus any optional extras you have.
Read The Numbers
See the rate, shots per goal, goals versus xG and the likely true range.
Compare Finishers
Add several players or teams and rank them.
What Is Shot Conversion Rate?
Shot conversion rate is the share of shots that become goals. If a striker scores 14 goals from 80 shots, their conversion rate is 17.5%. It is one of the simplest ways to judge finishing, and it is used by coaches, scouts, fantasy players and fans alike.
The GlobeHour Shot Conversion Rate Calculator goes further than one percentage. It shows the full shot funnel from shots to shots on target to goals, works out shots per goal, removes penalties for a fairer non-penalty rate, compares goals with expected goals, and splits shots inside and outside the box so you can check them against Premier League benchmarks. A likely true range shows how much a small record could be down to luck.
Shot Conversion Formulas
Example season: 80 shots, 14 goals, 32 on target, 11.2 xG, 2,700 minutes, 2 of 3 penalties scored, 12 goals from 60 shots inside the box.
| Measure | Formula | Example |
|---|---|---|
| Conversion Rate | Goals ÷ shots × 100 | 14 ÷ 80 = 17.5% |
| Shots Per Goal | Shots ÷ goals | 80 ÷ 14 = 5.71 |
| Shot Accuracy | Shots on target ÷ shots × 100 | 32 ÷ 80 = 40.0% |
| On-Target Conversion | Goals ÷ shots on target × 100 | 14 ÷ 32 = 43.8% |
| Non-Penalty Conversion | (Goals − penalty goals) ÷ (shots − penalties) | 12 ÷ 77 = 15.6% |
| Goals Vs xG | Goals − expected goals | 14 − 11.2 = +2.80 |
| xG Per Shot | Expected goals ÷ shots | 11.2 ÷ 80 = 0.14 |
| Goals Per 90 | Goals ÷ (minutes ÷ 90) | 14 ÷ 30 = 0.47 |
| Likely True Range | 95% Wilson score interval | 10.7% to 27.3% |
What Is A Good Shot Conversion Rate?
A good rate depends on where the shots come from. StatsBomb’s Premier League benchmarks for 2008/09 to 2012/13 found that shots inside the box, not counting penalties and direct free kicks, were scored about 13.1% of the time, with every season between 12.4% and 13.5%. Open-play shots from outside the box went in only about 2.7% of the time, or roughly 1 in 37. Direct free kicks were scored 6.6% of the time and penalties 75.6%.
So a forward who takes most of their shots inside the box should be well above 10%, while a midfielder who shoots a lot from distance will naturally have a lower rate. This calculator labels the overall rate as follows when no xG is entered:
| Label | Conversion Rate | What It Suggests |
|---|---|---|
| Lethal | 20% or more | Elite finishing or very high quality chances |
| Clinical | 15% to 19.9% | Strong finishing for a forward |
| Solid | 10% to 14.9% | Around what box shots usually return |
| Wasteful | 5% to 9.9% | Many low quality or missed chances |
| Struggling | Under 5% | Shot selection or finishing needs work |
Conversion Rate Vs Expected Goals
Expected goals (xG) gives every shot a value between 0 and 1 based on how often similar shots are scored. Adding up the xG of all shots shows how many goals an average finisher would have scored from the same chances.
Comparing goals with xG separates finishing from chance quality. A player with a low conversion rate may simply be shooting from difficult positions, while a player with a high rate may be getting tap-ins. When xG is entered, the calculator labels the record as:
- Clinical Finisher: goals at least 15% above xG.
- Finishing As Expected: goals within 15% of xG.
- Wasteful Finisher: goals more than 15% below xG.
In the example season, 14 goals from 11.2 xG is +2.80, or 1.25 times expected, so the player is a clinical finisher. Their xG per shot of 0.14 also shows they took good chances on average.
Why The Likely True Range Matters
Conversion rates jump around a lot over short spells. Two lucky deflections can turn an average month into a brilliant one. The calculator uses the Wilson score interval, a standard statistical method, to show a 95% likely true range for the player’s real long-term rate.
For the example of 14 goals from 80 shots, the range is 10.7% to 27.3%. That is wide, even after a full season of shots. As more shots are added, the range narrows and the rate becomes a more reliable guide.
Why Use Non-Penalty Conversion?
Penalties are scored about three times out of four, far more often than any other shot. A player who takes their team’s penalties gets a big boost to their overall conversion rate that has little to do with open-play finishing.
Enter penalties taken and scored to get a non-penalty conversion rate. In the example, the rate drops from 17.5% to 15.6% once the 3 penalties are removed. Use the non-penalty figure when comparing a penalty taker with a player who doesn’t take them.
Tips To Improve Shot Conversion
- Get into the box more often, as chances there are far easier.
- Pass up low quality long shots when a better option is on.
- Hit the target first, as shots off target can never score.
- Practise first-time finishes from crosses and cut-backs.
- Aim low and towards the corners away from the goalkeeper.
- Stay composed, pick a spot and keep your head over the ball.
- Track your shots in training and matches to spot patterns.
- Teams: build attacks that create clear chances, not just more shots.
Shot Conversion Rate Calculator FAQ
How Do You Calculate Shot Conversion Rate?
Divide goals by total shots and multiply by 100. For example, 14 goals from 80 shots is a 17.5% conversion rate.
Is The Shot Conversion Calculator Free?
Yes. It is completely free, needs no sign-up and works on phones, tablets and computers.
What Is A Good Shot Conversion Rate?
It depends on where shots are taken. Premier League shots inside the box, excluding penalties and free kicks, were scored about 13.1% of the time in StatsBomb’s 2008/09 to 2012/13 benchmarks. A forward above 15% overall is finishing well.
Do Blocked Shots Count As Shots?
Yes. Most data providers count blocked shots as shots but not as shots on target. Use the same source for every record you compare.
What Is The Difference Between Conversion Rate And Shot Accuracy?
Conversion rate is goals divided by shots. Shot accuracy is shots on target divided by shots. A player can be accurate but still have a low conversion rate if goalkeepers save their shots.
Should Penalties Be Included?
They are included in the main rate, but you can enter penalties taken and scored to see a non-penalty conversion rate, which is fairer when comparing players.
What Does Goals Vs xG Mean?
It is goals scored minus expected goals. A positive number means the player scored more than an average finisher would from the same chances.
What Is The Likely True Range?
It is a 95% Wilson score interval. It shows the range the real long-term conversion rate probably falls in, given the number of shots.
Can I Use It For A Whole Team?
Yes. Choose Team in step one and enter the team’s total shots and goals.
Is My Information Saved?
Your records are saved only in your own browser. Nothing is sent to GlobeHour.
Related GlobeHour Football Tools
Ready To Check The Finishing?
Shots and goals are all you need. Add xG, penalties and shot location for the full picture.
Open The Shot Conversion Calculator