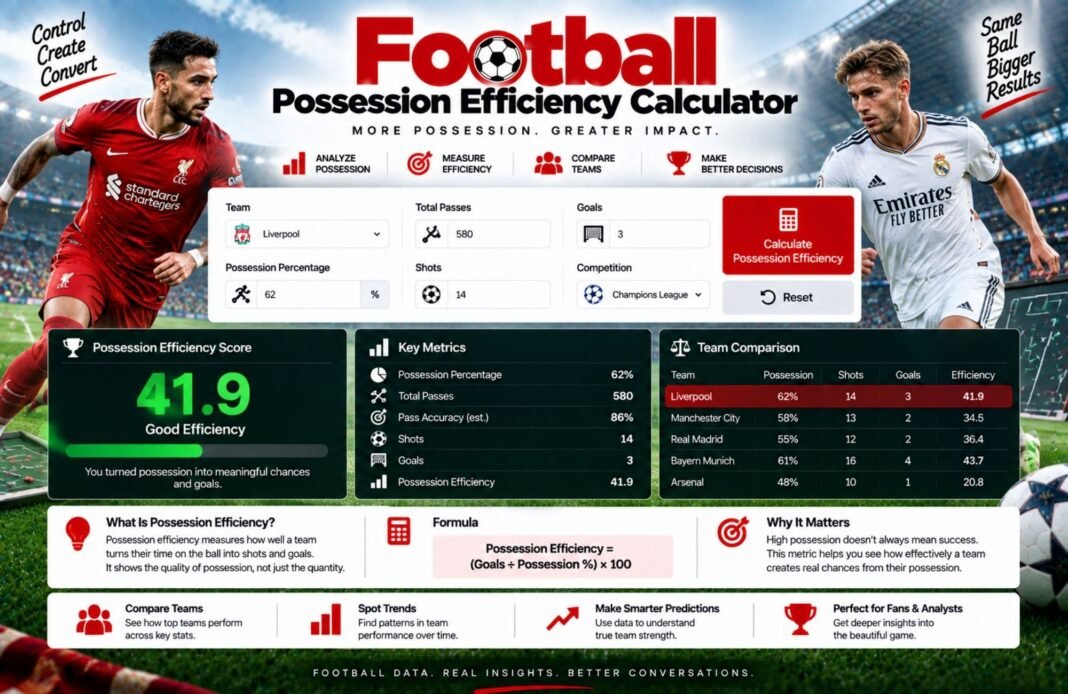
Want to know how reliable a player is from the penalty spot? Our Penalty Conversion Rate Calculator shows the percentage of penalties successfully scored using total penalties taken and goals scored. It’s a quick way to measure penalty-taking accuracy and compare players’ records.
Penalty Conversion Rate Calculator
Work out a penalty taker’s conversion rate or a goalkeeper’s penalty stop rate, compare it with the Premier League average, see goals above expected and find the likely true range behind a small sample.
- Record Type
- Enter Penalties
- Conversion Rate
Whose Penalty Record Is It?
Takers get a conversion rate. Goalkeepers get a stop rate and goals prevented.
Enter Penalties Taken
Count penalties in normal and extra time. Leave out shootouts unless you want to include them.
Miss Breakdown (optional)
Extra (optional)
Target (optional)
Please check the numbers: scored, saved or missed can’t be more than the total.
Compare Penalty Takers
Rank records by rate. Takers and goalkeepers are kept in separate lists. Saved in this browser.
How Often Are Penalties Scored?
Out of every 100 Premier League penalties, about 78 are scored.
How The Penalty Calculator Works
Four quick steps from a penalty record to a clear rate.
Choose The Record
Pick a penalty taker, a team or a goalkeeper.
Enter The Penalties
Add penalties taken and scored, or faced and saved.
Read The Numbers
See the rate, goals versus expected and the likely true range.
Compare Records
Add several takers or goalkeepers and rank them.
What Is A Penalty Conversion Rate?
Penalty conversion rate is the share of penalties a player or team scores. It is the main way to judge a penalty taker, and it is often the deciding factor when a coach picks who steps up.
The GlobeHour Penalty Conversion Rate Calculator goes beyond a simple percentage. It compares the record with the long-run Premier League average, shows goals above or below expected using the 0.78 expected goals value of a penalty, and calculates a likely true range so you can see how much a small record could be down to luck. Switch to goalkeeper mode to measure how often a keeper stops penalties.
Penalty Conversion Formulas
Example taker: 12 penalties taken, 10 scored, 1 of the misses saved.
| Measure | Formula | Example |
|---|---|---|
| Conversion Rate | Scored ÷ taken × 100 | 10 ÷ 12 = 83.3% |
| Expected Goals | Penalties taken × 0.78 | 12 × 0.78 = 9.36 |
| Goals Vs Expected | Scored − expected goals | 10 − 9.36 = +0.64 |
| Penalties Per Miss | Taken ÷ missed | 12 ÷ 2 = 6.0 |
| Saved By Keeper | Saved misses ÷ taken × 100 | 1 ÷ 12 = 8.3% |
| Likely True Range | 95% Wilson score interval | 55.2% to 95.3% |
What Is The xG Of A Penalty?
Expected goals (xG) measures how likely a shot is to be scored. Opta gives every penalty the same value of 0.78, meaning an average penalty is scored about 78% of the time.
That makes penalties a useful way to judge finishing. A taker who scores more than 0.78 goals per penalty over many attempts is beating the average, and the calculator shows this as goals versus expected. For a goalkeeper, conceding fewer than 0.78 goals per penalty faced means they are preventing goals.
Why The Likely True Range Matters
Most players only take a handful of penalties, so their records can swing a lot on one kick. A player who has scored 5 out of 5 has a 100% record, but that does not mean they will never miss.
The calculator uses the Wilson score interval, a standard statistical method, to show a 95% likely true range. For the example of 10 scored from 12, the range is 55.2% to 95.3%. As more penalties are added, the range gets narrower and the conversion rate becomes a more reliable guide.
Goalkeeper Penalty Stats
In goalkeeper mode, enter penalties faced and penalties saved, and optionally penalties the taker missed. The calculator then shows:
- Stop rate: penalties saved or missed ÷ penalties faced.
- Save rate: penalties saved by the goalkeeper ÷ penalties faced.
- Goals prevented: expected goals (0.78 per penalty) minus goals conceded.
For example, a goalkeeper who faced 20 penalties, saved 4 and saw 1 missed has a 25.0% stop rate, a 20.0% save rate and prevented 0.60 goals compared with expected. Since about 78% of penalties are scored, roughly 22% are stopped or missed on average.
Tips For Better Penalties
- Decide where you will shoot before you start your run-up.
- Use the same routine every time to stay calm.
- Practise under pressure, for example at the end of training.
- Aim close to the posts, away from the goalkeeper’s reach.
- Keep your body over the ball to keep the shot down.
- Choose a technique you trust and stick to it.
- Track your own record in training and matches.
- Goalkeepers: study takers’ favourite sides where possible.
Penalty Conversion Rate Calculator FAQ
How Do You Calculate Penalty Conversion Rate?
Divide penalties scored by penalties taken and multiply by 100. For example, 10 scored from 12 taken is 83.3%.
Is The Penalty Calculator Free?
Yes. It is completely free, needs no sign-up and works on phones, tablets and computers.
What Is A Good Penalty Conversion Rate?
About 78% of Premier League penalties have been scored over the long run, so anything above that is better than average. In this calculator, 90% or more is labelled ice cold.
What Is The xG Of A Penalty?
Opta gives every penalty an expected goals value of 0.78.
Should Shootout Penalties Be Included?
Most records only count penalties in normal and extra time. You can include shootouts, but keep the same approach when comparing players.
What Does Goals Vs Expected Mean?
It is the number of penalties scored minus 0.78 for every penalty taken. A positive number means the taker scored more than an average taker would.
What Is The Likely True Range?
It is a 95% Wilson score interval. It shows the range the taker’s real long-term rate probably falls in, given how few penalties most players take.
How Are Goalkeepers Measured?
Goalkeeper mode shows the stop rate, the save rate and goals prevented compared with the 0.78 expected goals value of each penalty.
Can I Compare Several Takers?
Yes. Calculate each record and press Add To Comparison. Takers and goalkeepers are ranked in separate lists.
Is My Information Saved?
Your records are saved only in your own browser. Nothing is sent to GlobeHour.
Related GlobeHour Football Tools
Ready To Check The Penalties?
Penalties taken and scored are all you need. Get the rate, the expected goals comparison and the likely true range.
Open The Penalty Calculator